14. Excel How to add a secondary axis ?
Consider the following spreadsheet extract:
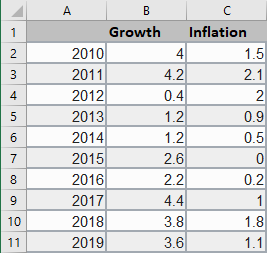
Let's create a histogram for the two data series "Growth" and "Inflation":
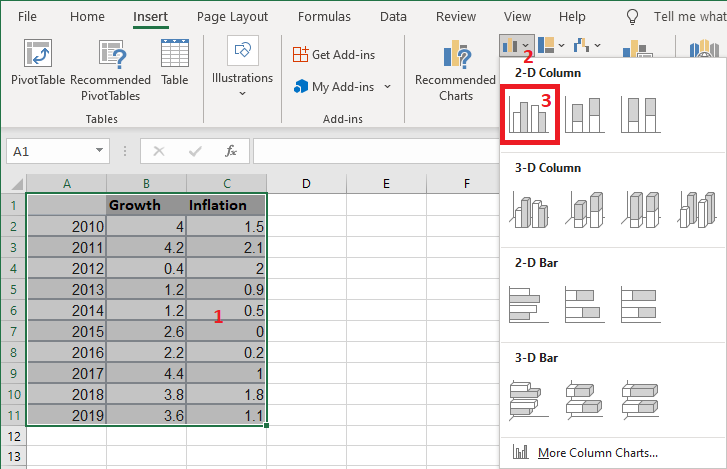
- Select the cell range A1:C11
- Click on the Insert tab of the Ribbon
- Click on the Insert Column or Bar Chart command.
- Choose the Clustered Column sub-type.
Resulting graph :
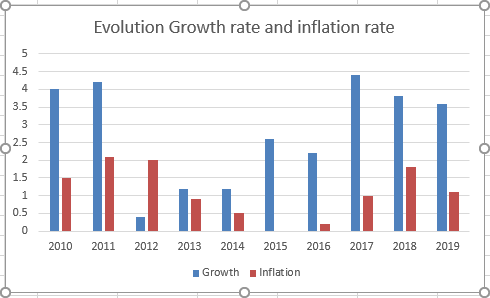
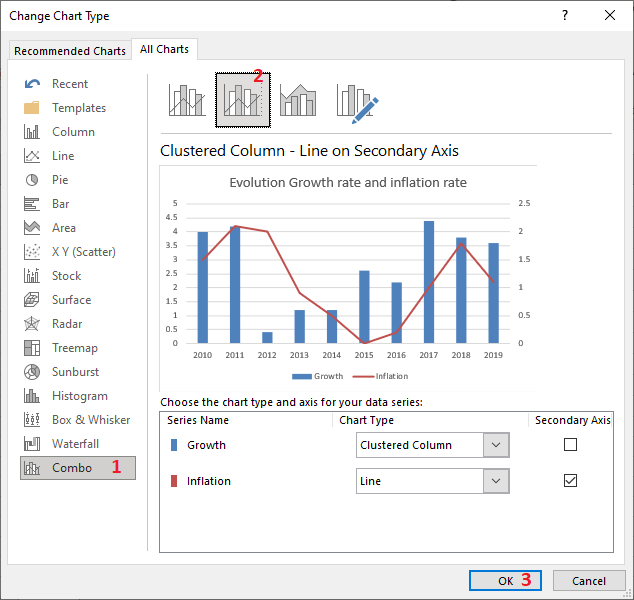
The two data sets "Growth" and "Inflation" should not have the same axis. So let's create a secondary axis for the "Inflation" data series and with the type Line. Proceed as follows:
- Select the chart.
- Click the Change Chart Type button on the Chart Design tab of the ribbon
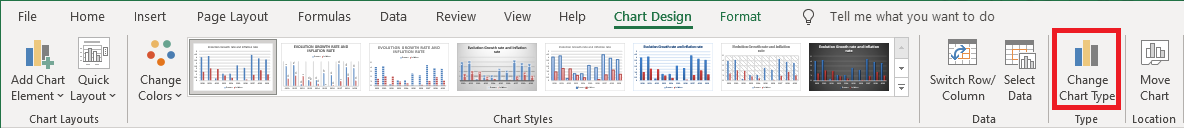
- In the Change Chart Type dialog box that appears :
- Click the Combo tab
- Click on the Clustered Column - Line on Secondary Axis button
- Confirm with the OK button.
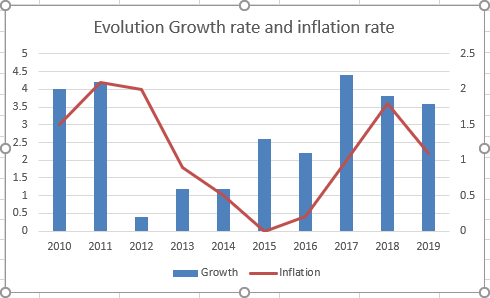
You should have the following graph :
Reader comments
